
TripleO on NUCs

nucs

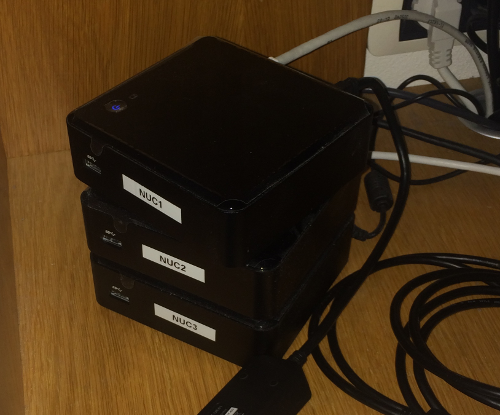
Being a happy owner of a couple of Intel DC53427HYE NUCs NUCs, I decided I would install TripleO on them.

My setup consists of the following:

  • Undercloud (nuc1.int.rhx) with two interfaces (the internal eno1 connected to my home LAN-172.16.11.0/20 and an additional USB-Ethernet dongle enp0s29u1u5u1 which is connected to a separate segment where the other two NUCs are connected-192.0.2.0/24)
  • Two NUCs on which the AMT IP address has been configured as 192.0.2.100 (nuc2) and 192.0.2.101 (nuc3)

I won't delve too much into the details of TripleO, see the official docs if you need more information: http://tripleo.org/, but here are the steps I took after installing Centos 7.2 and applying this http://acksyn.org/files/tripleo/nuc.patch.

Steps

yum install -y vim tmux wsmancli
cat > /etc/hosts <<EOF
127.0.0.1   localhost localhost.localdomain localhost4 localhost4.localdomain4 nuc1 nuc1.int.rhx
::1         localhost localhost.localdomain localhost6 localhost6.localdomain6
EOF

useradd stack
echo "foobar" | passwd --stdin stack
echo "stack ALL=(root) NOPASSWD:ALL" | sudo tee -a /etc/sudoers.d/stack
sudo chmod 0440 /etc/sudoers.d/stack

su - stack
sudo yum -y install epel-release  yum-plugin-priorities 
sudo curl -o /etc/yum.repos.d/delorean.repo http://trunk.rdoproject.org/centos7/current-tripleo/delorean.repo
sudo curl -o /etc/yum.repos.d/delorean-current.repo http://trunk.rdoproject.org/centos7/current/delorean.repo
sudo sed -i 's/\[delorean\]/\[delorean-current\]/' /etc/yum.repos.d/delorean-current.repo
sudo /bin/bash -c "cat <<EOF>>/etc/yum.repos.d/delorean-current.repo
includepkgs=diskimage-builder,openstack-heat,instack,instack-undercloud,openstack-ironic,openstack-ironic-inspector,os-cloud-config,os-net-config,python-ironic-inspector-client,python-tripleoclient,tripleo-common,openstack-tripleo-heat-templates,openstack-tripleo-image-elements,openstack-tuskar-ui-extras,openstack-puppet-modules
EOF"

sudo curl -o /etc/yum.repos.d/delorean-deps.repo http://trunk.rdoproject.org/centos7/delorean-deps.repo
sudo yum install -y python-tripleoclient

cat > ~/undercloud.conf <<EOF
[DEFAULT]
local_interface = enp0s29u1u5u1
[auth]
EOF

openstack undercloud install 2>&1 | tee undercloud_install.log

# build images
export NODE_DIST=centos7
export USE_DELOREAN_TRUNK=1
export DELOREAN_TRUNK_REPO="http://trunk.rdoproject.org/centos7/current-tripleo/"
export DELOREAN_REPO_FILE="delorean.repo"
time openstack overcloud image build --all 2>&1 | tee build_images.log

openstack overcloud image upload

cat > instackenv.json << EOF
{
  "nodes":[
  {
    "_comment":"nuc2",
    "pm_type":"pxe_amt",
    "mac": [
        "ec:a8:6b:fa:65:c7"
    ],
    "cpu": "4",
    "memory": "7500",
    "disk": "100",
    "arch": "x86_64",
    "pm_user":"admin",
    "pm_password":"foobar",
    "pm_addr":"192.0.2.100"
  },
  {
    "_comment":"nuc3",
    "pm_type":"pxe_amt",
    "mac": [
        "b8:ae:ed:71:3e:20"
    ],
    "cpu": "4",
    "memory": "7500",
    "disk": "100",
    "arch": "x86_64",
    "pm_user":"admin",
    "pm_password":"foobar",
    "pm_addr":"192.0.2.101"
  }
  ]
}
EOF
json_verify < instackenv.json

openstack baremetal import --json instackenv.json
openstack baremetal configure boot

openstack baremetal introspection bulk start
openstack overcloud deploy --templates

Expected Outcome

If everything goes according to plan, we shall expect to see this message:

2016-03-03 16:34:32 [overcloud-BlockStorageNodesPostDeployment-zdtbamwswrr2]: CREATE_COMPLETE Stack CREATE completed successfully
Stack overcloud CREATE_COMPLETE

Caveats

  • Sleep modes. Because I turn off the NUCs via a power switch and because it puts the AMT processor in sleep mode and it needs an ICMP packet to wake up - which can take up to 25 seconds - I just went ahead and disabled the AMT Power Saving Policy by choosing: "Mobile: ON in S0". If you do not do this you might have to tweak the max_attempts and the action_wait parameters under amt in /etc/ironic/ironic.conf on the undercloud.

  • If most ironic operations fail and you see the following error in the logs:

    2016-03-02 22:06:28.433 23958 WARNING ironic.conductor.manager [-] During sync_power_state, could not get power state for node 8afb31f9-6cef-4629-8a2a-5822a968b15d, attempt 1 of 3. Error: Wrong number or type of arguments for overloaded function #'new_Client'. Possible C/C++ prototypes are: _WsManClient::_WsManClient(char const ) _WsManClient::_WsManClient(char const ,int const,char const ,char const ,char const ,char const )

    It is because the protocol string (in this case 'http') passed from ironic to the driver is actually u"http" which confuses the openwsman SWIG bindings. This is something I need to look at in more detail. For a quick fix I just hardcoded the proper string in parse_driver_info in ironic/drivers/modules/amt/common.py.

  • AMT seems to be flakey at times. While most of my deployments worked, a couple of times the AMT would just go on strike and some of the deployment steps would fail due to timeouts. I will also see if firmware updates will fix this. I haven't hit this https://bugs.launchpad.net/ironic/+bug/1454492 yet, but it seems that it can easily happen. Apparently a new python-only AMT driver is in the works.

Future

Over the next days, or better evenings, I will cleanup up the (trivial) patches so this all works out of the box. The changes are quite minimal but I need to kill the wsmancli dependency and test things a bit more (I also need to retest everything with openwsman 2.4 as shipped by CentOS, because I used a locally installed 2.6.2 version while chasing the unicode parameter bug mentioned above). I hope this saves some time to anyone trying the same ;)

Running Fedora MIPS

There is an ongoing effort to revive Fedora for MIPS. In order to get a glimpse of this work in QEMU, do the following:

  • Download the qcow mipsel64el image here
  • Download the kernel here

Run your MIPS qemu instance as follows (note that I use a bridge called vnet0 on my host):

qemu-system-mips64el -M malta \
    -cpu 5KEc \
    -m 2048 \
    -kernel vmlinux-3.19.3.mtoman.20150408 \
    -drive file=fedora-22-mips64el-20150601.qcow2 \
    -netdev bridge,id=hub0port0,br=vnet0 -device e1000-82545em,netdev=hub0port0,id=foo \
    -append "ro root=/dev/sda1 console=ttyS0 mem=256m@0x0 mem=1792m@0x90000000" \
    -serial stdio \
    -nographic \
    -monitor pty

Performance Monitoring with PCP and Vector

Update: FchE notes that the pcp-webapp-vector package is already part of Fedora, instructions amended

Netflix recently announced their new Vector open-source monitoring tool. Vector uses Perfomance Co-Pilot as a framework to fetch and manage metrics and provides a nice web GUI on top of it.

Installation

The following steps are tested on Fedora 22 (or a pre-release of it in this case). First let's install the needed packages:

dnf install -y pcp pcp-webapi pcp-webapp-vector

Let's get pcp and pcp-webapi configured and started first:

systemctl enable pmcd pmwebd
systemctl start pmcd pmwebd

At this point Vector is already installed correctly. If you installed vector on your machine running a browser you simply need to point it to, otherwise replace localhost with the machine where pmwebd+vector are running:

http://localhost:44323/vector/

Note that Vector, which runs within the browser will connect to the remote 44323/tcp pmwebd port, so make sure it is accessible.

Usage

Once everything is installed correctly we simply need to open a browser on and point it to the system where we installed Vector on port 8080. Within the web UI we can then choose any server which has pmwebd running:

vector

Terminal Calendaring Application

As an avid mutt-kz user, I always found it quite annoying to have to use a web browser or my phone to check out my work calendar or upcoming birthdays. I have slowly started to use khal which is shaping up to be a very nice calendaring application for use within terminals:

khal

For Fedora users I have created a COPR repo. As root, simply run:

dnf copr enable mbaldessari/khal

and then launch:

dnf install khal

This will install the following packages: python-atomicwrites, vdirsyncer and khal Once installed, we need to tell vdirsyncer where to fetch the caldav entries from. My ~/.vdirsyncer/config is as follows and contains my birthday list from Facebook and my work calendar:

At this point you can run vdirsyncer sync and the entries will be fetched and stored locally. Note that if you get SSL validation errors you most likely need to import your company Root CA:

# cp MY-CA-root-cert.pem /etc/pki/ca-trust/source/anchors/
# update-ca-trust extract

Once vdirsyncer has completed fetching all the entries, it is time to display them in khal or in its interactive cousin ikhal. Here is my ~/.config/khal/khal.conf file:

That's it. There is still some work todo before I can ditch other calendaring applications completely. Namely:

Let me know if you have any issues with the copr repo.

Performance Analysis with Performance Co-Pilot, iPython and pandas

Introduction

One of many reasons to love Performance Co-Pilot, is the fact that it is a fully fledged framework to do performance analysis. It makes it extremely simple to extend and to build anything on top of it. In this post we shall explore how simple it is to analyze your performance data using iPython and pandas.

panda

Setup

To start we will need some PCP archives which contain some collected metrics from a system. In this post I will use the data I collect on my home firewall and will try to analyze some of the data there in. To learn how to store performance metrics in an archive, take a look at pmlogger and the Quickstart guide. For this example I collected data over the course of a day with a 1 minute interval.

iPython and PCP

First of all you need to import a small python module that bridges PCP and pandas/numpy:

git clone https://github.com/mbaldessari/pcpinteractive.git
cd pcpinteractive

Now let us start our iPython console, import our python module and load our archive:

At this point the data is fully parsed in memory and we can start analyzing it, using all the standard tools like pandas and matplotlib. Let's start by looking at how many metrics are present in the archive:

Pandas and PCP

Now we can get a pandas object out of a metric. Let's take incoming and outgoing network traffic expressed in bytes over time.

We can now graph the data obtained with a simple:

netpcpmatplot

And we can also explore the data with the use of the describe() method, but first let's force the output to be in non-scientific notation as it is more readable for network data:

Manipulate the data

Now let's see what is possible to do in terms of data manipulation: * Drop columns we do not care about:

Or, alternatively:

  • Resample data at lower intervals

  • Filter out all the zero columns

  • Show last element:

  • Select a smaller timeframe:

  • Get one column with:

  • Apply a function on the whole dataframe:

  • Sum all values for each column:

  • Calculate the mean for each column:

  • Find the time of day when the max values are reached

  • Select only the tun0 and eth0 devices:

Merge and group dataframes

Now let's merge the net_in and the net_out dataframes into a single one, in order to try and do some analysis on both traffic directions at the same time.

Another very interesting aspect is the plethora of statistical functions that come for free through the use of pandas. For example, to find covariance() and correlation() we can use the following methods:

We can also group columns like the following:

Calculate the rolling mean of an interface and plot it:

rollingmean

Export data

Save the data in csv file or in excel format:

Other outputs like latex, sql, clipboard, hd5f and more are supported.

Conclusions

The versatility of PCP allows anyone to use many currently available frameworks (numpy, pandas, R, scipy) to analyze and display the collected performance data. There is some work to be done to make this process a bit simpler with an out of the box PCP installation.

Observing X11 protocol differences

I was trying to understand some oddities going with an X11 legacy application showing bad artifacts in one environment and working flawlessly in another environment. Since wireshark does not have any support for diffing two pcaps, I came up with the following steps:

  • Dump both working.pcap and nonworking.pcap into text files with full headers:
~/Devel/wireshark/tshark -r working.pcap -T text -V -Y "x11" > working.txt
~/Devel/wireshark/tshark -r notworking.pcap -T text -V -Y "x11" > notworking.txt
  • Prune the two text files with a script like the following:
def clean(source, dest):
    f = open(source, "r")
    x11_state = False
    output = []
    for line in f.readlines():
        if x11_state:
            if line.startswith(' '):
                output.append(line)
            else:
                x11_state = False
        else:
            if line.startswith('X11') and \
                    "Property" in line:
                output.append(line)
                x11_state = True
            else:
                continue
    o = open(dest, "w")
    for i in output:
        o.write(i)

if __name__ == '__main__':
    clean("working.txt", "working-trimmed.txt")
    clean("notworking.txt", "notworking-trimmed.txt")
  • At this point we can easily vimdiff the outputs obtained from above via vimdiff working-trimmed.txt notworking-trimmed.txt: vimdiff

Performance Co-Pilot and Arduino (part 2)

After initially setting up Performance Co-Pilot and Arduino, I wanted to improve the data being displayed. As latency is quite important to me, I wanted to display that as well. I did not have too much time on my hands to code a new PMDA that collects that information, so I abused the pmdashping(1) for this purpose. The steps are simple:

  1. Go to /var/lib/pcp/pmdas/shping
  2. Create sample.conf with the following line:
8.8.8.8 /var/lib/pcp/pmdas/shping/ping.sh
  1. Create /var/lib/pcp/pmdas/shping/ping.sh:
#!/bin/sh
# This hack will break if latency > 254 ;)
ret=`ping -c 2 -n -q acksyn.org | grep ^rtt | cut -f5 -d\/ | cut -f1 -d\.`
exit $ret
  1. Launch ./Install and choose [2] ./sample.conf
  2. Now it is possible to abuse the shping.error metric to fetch that value:
    $ pminfo -f shping.error
    shping.error
       inst [0 or "8.8.8.8"] value 52

The last step was to fetch this via PMWEBAPI(3). This did not work until I realized, thanks to Fche's suggestion that the issue was related to my inital context initialization. As a matter of fact there is a big difference between the following two:

  • /pmapi/context?local=ANYTHING - Creates a PM_CONTEXT_LOCAL PMAPI context.
  • /pmapi/context?hostname=STRING - Creates a PM_CONTEXT_HOST PMAPI context with the given host name and/or extended specification.

The man page of pmNewContext(3) explains this in more detail. Frank has added some more info to the PMWEBAPI(3) man page via the following commit, to make it a little bit more obvious. It's still a pretty gross hack, but for the time being it's enough for my needs.

arduino-pcp

Performance Co-Pilot and Arduino

Besides being an incredible nice toolkit to work with, Performance Co-Pilot is extremely simple to integrate with any application. Amongst an extensive API it allows to export any metric via JSON using the PMWEBAPI(3). I actived this feature on my Soekris firewall by installing PCP and running both the pmcd and the pmwebd services. Once pmwebd is active, querying any metric is quite simple:

  • In python the first step is to get a context:
    req = requests.get(url=url + 'pmapi/context?local=foo')
    resp = req.json()
    ctx_local = resp['context']
  • With this context we can get info about a specific metric:
    ctxurl = url + 'pmapi/' + str(ctx_local) + '/'
    req = requests.get(url=ctxurl + '_fetch?names=network.interface.out.bytes')
    resp = req.json()

The returned JSON is something along the following lines:

{u'timestamp': {u's': 1412888245, u'us': 443665}, u'values': [{u'instances': 
   [{u'instance': 0, u'value': 503730734}, {u'instance': 1, u'value': 17610637798}, ...

Armed with an Arduino with a 328 Atmel onboard, an Ethernet shield and a 2x16 LCD I wanted to display my ADSL bandwith use. Instead of having to write a network parser for the PCP protocol (or worse SNMP), it's simple to use the exported JSON data for this. Here are the results:

arduino-pcp

I'll eventually clean up the C code I used for this and publish it somewhere.

Direction of Captured Packets

When capturing network traffic on an interface, it is usually pretty obvious which direction the packets are going. Let's take a typical Linux machine that hosts some VMs over a linux bridge. The interfaces will look like this:

Physical   Linux     Linux      VM
  Nic      Bridge     Tap     Interface
--------  -------  ---------  --------
| eth0 |--| br0 |--| vnet0 |--| eth0 |
--------  -------  ---------  --------

When the VM does an ARP resolution we will see the following on the host's eth0:

52  33.575036 52:54:00:11:22:33 -> ff:ff:ff:ff:ff:ff    ARP 42   Who has 192.168.0.254?  Tell 192.168.1.70 
53  33.577890 00:00:0c:4f:2a:30 -> 52:54:00:11:22:33    ARP 60   192.168.0.254 is at 00:00:0c:4f:2a:30

In this case it is clear that, from eth0's point of view, packet 52 is outgoing and 53 is the incoming reply. There are some situations though, where this is not completely obvious:

58  22.252109 52:54:00:11:22:33 -> ff:ff:ff:ff:ff:ff    ARP 42   Who has 192.168.0.254?  Tell 192.168.1.70
59  22.252202 52:54:00:11:22:33 -> ff:ff:ff:ff:ff:ff    ARP 42   Who has 192.168.0.254?  Tell 192.168.1.70
60  22.254918 00:00:0c:4f:2a:30 -> 52:54:00:11:22:33    ARP 60   192.168.0.254 is at 00:00:0c:4f:2a:30

In the above example, we could assume that both 58 and 59 were outgoing packets, but we'd be wrong. Although size 42 suggests that it has not been padded to ethernet's minimal frame size, frame number 59 is not really coming from the "external network". One hint is that arp requests are sent with a second interval between each request, so it'd be unlikely that the VM is the creator of the second packet too. So where is 59 coming from? It turns out that with SR-IOV enabled, some cards' onboard switch loops packets back. Why is that a problem? Glad you asked.

When the Linux bridge sees packet 59, it records the mac-address 52:54:00:11:22:33 as coming from eth0, and not from the locally connected vnet0 tunnel. When packet 60 arrives, the bridge will drop it because it believes the destination MAC address is on eth0.

Long story short, in order to troubleshoot these kinds of issues, I know of three ways to be able to see the direction of packets:

tcpdump

With a fairly recent tcpdump/libpcap you can specify the -P in|out|inout option and capture traffic in a specific direction. In a situation like the one described here, it will be a bit cumbersome as you will need two separate tcpdump instances, but it works.

netsniff-ng

netsniff-ng can do an incredible number of cool things. Amongst others, it shows the direction of packets by default:

< em1 60 1400412101s.907918291ns 
 [ Eth MAC (00:00:24:cc:27:40 => 2c:41:38:ab:99:e2), Proto (0x0806, ARP) ]
 [ Vendor (CONNECT AS => Hewlett-Packard Company) ]
 [ ARP Format HA (1 => Ethernet), Format Proto (0x0800 => IPv4), HA Len (6), Proto Len (4), Opcode (1 => ARP request) ]
 [ Chr .................. ]
 [ Hex  00 00 00 00 00 00 00 00 00 00 00 00 00 00 00 00 00 00 ]

> em1 42 1400412101s.907936759ns 
 [ Eth MAC (2c:41:38:ab:99:e2 => 00:00:24:cc:27:40), Proto (0x0806, ARP) ]
 [ Vendor (Hewlett-Packard Company => CONNECT AS) ]
 [ ARP Format HA (1 => Ethernet), Format Proto (0x0800 => IPv4), HA Len (6), Proto Len (4), Opcode (2 => ARP reply) ]

pktdump

pktdump is the most user-friendly of the three. It is not in Fedora, but I've build a COPR repo here. Here's an example output:

# pktdump -i em1 -f 'arp'
Capturing packets on the 'em1' interface
[12:24:07] RX(em1) : ARP| REQUEST 00:00:24:CC:27:40 192.168.0.254 00:00:00:00:00:00 foo.int.
[12:24:07] TX(em1) : ARP| REPLY 2C:41:38:AB:99:E2 foo.int 00:00:24:CC:27:40 192.168.0.254

It's especially useful when trying to follow the route packets are taking in a complex multi-interface setup.