Performance Analysis with Performance Co-Pilot, iPython and pandas
Introduction
One of many reasons to love Performance Co-Pilot, is the fact that it is a fully fledged framework to do performance analysis. It makes it extremely simple to extend and to build anything on top of it. In this post we shall explore how simple it is to analyze your performance data using iPython and pandas.

Setup
To start we will need some PCP archives which contain some collected metrics from a system. In this post I will use the data I collect on my home firewall and will try to analyze some of the data there in. To learn how to store performance metrics in an archive, take a look at pmlogger and the Quickstart guide. For this example I collected data over the course of a day with a 1 minute interval.
iPython and PCP
First of all you need to import a small python module that bridges PCP and pandas/numpy:
git clone https://github.com/mbaldessari/pcpinteractive.git
cd pcpinteractive
Now let us start our iPython console, import our python module and load our archive:
At this point the data is fully parsed in memory and we can start analyzing it, using all the standard tools like pandas and matplotlib. Let's start by looking at how many metrics are present in the archive:
Pandas and PCP
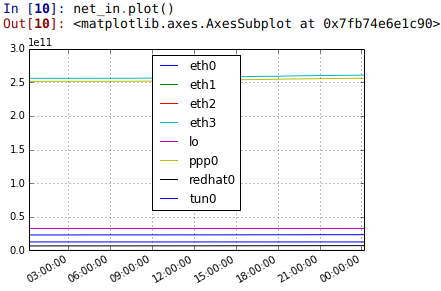
Now we can get a pandas object out of a metric. Let's take incoming and outgoing network traffic expressed in bytes over time.
We can now graph the data obtained with a simple:
And we can also explore the data with the use of the describe() method, but first
let's force the output to be in non-scientific notation as it is more readable for
network data:
Manipulate the data
Now let's see what is possible to do in terms of data manipulation: * Drop columns we do not care about:
Or, alternatively:
-
Resample data at lower intervals
-
Filter out all the zero columns
-
Show last element:
-
Select a smaller timeframe:
-
Get one column with:
-
Apply a function on the whole dataframe:
-
Sum all values for each column:
-
Calculate the mean for each column:
-
Find the time of day when the max values are reached
-
Select only the tun0 and eth0 devices:
Merge and group dataframes
Now let's merge the net_in and the net_out dataframes into a single one, in order
to try and do some analysis on both traffic directions at the same time.
Another very interesting aspect is the plethora of statistical functions that come for free through the use of pandas. For example, to find covariance() and correlation() we can use the following methods:
We can also group columns like the following:
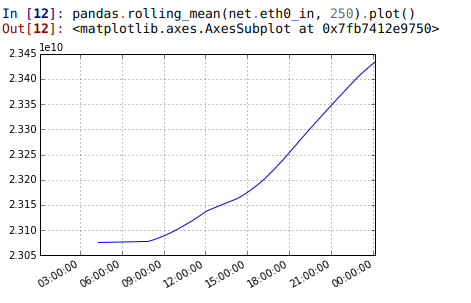
Calculate the rolling mean of an interface and plot it:
Export data
Save the data in csv file or in excel format:
Other outputs like latex, sql, clipboard, hd5f and more are supported.
Conclusions
The versatility of PCP allows anyone to use many currently available frameworks (numpy, pandas, R, scipy) to analyze and display the collected performance data. There is some work to be done to make this process a bit simpler with an out of the box PCP installation.